


0
Currency & Commodity Analysis:
US Dollar Index
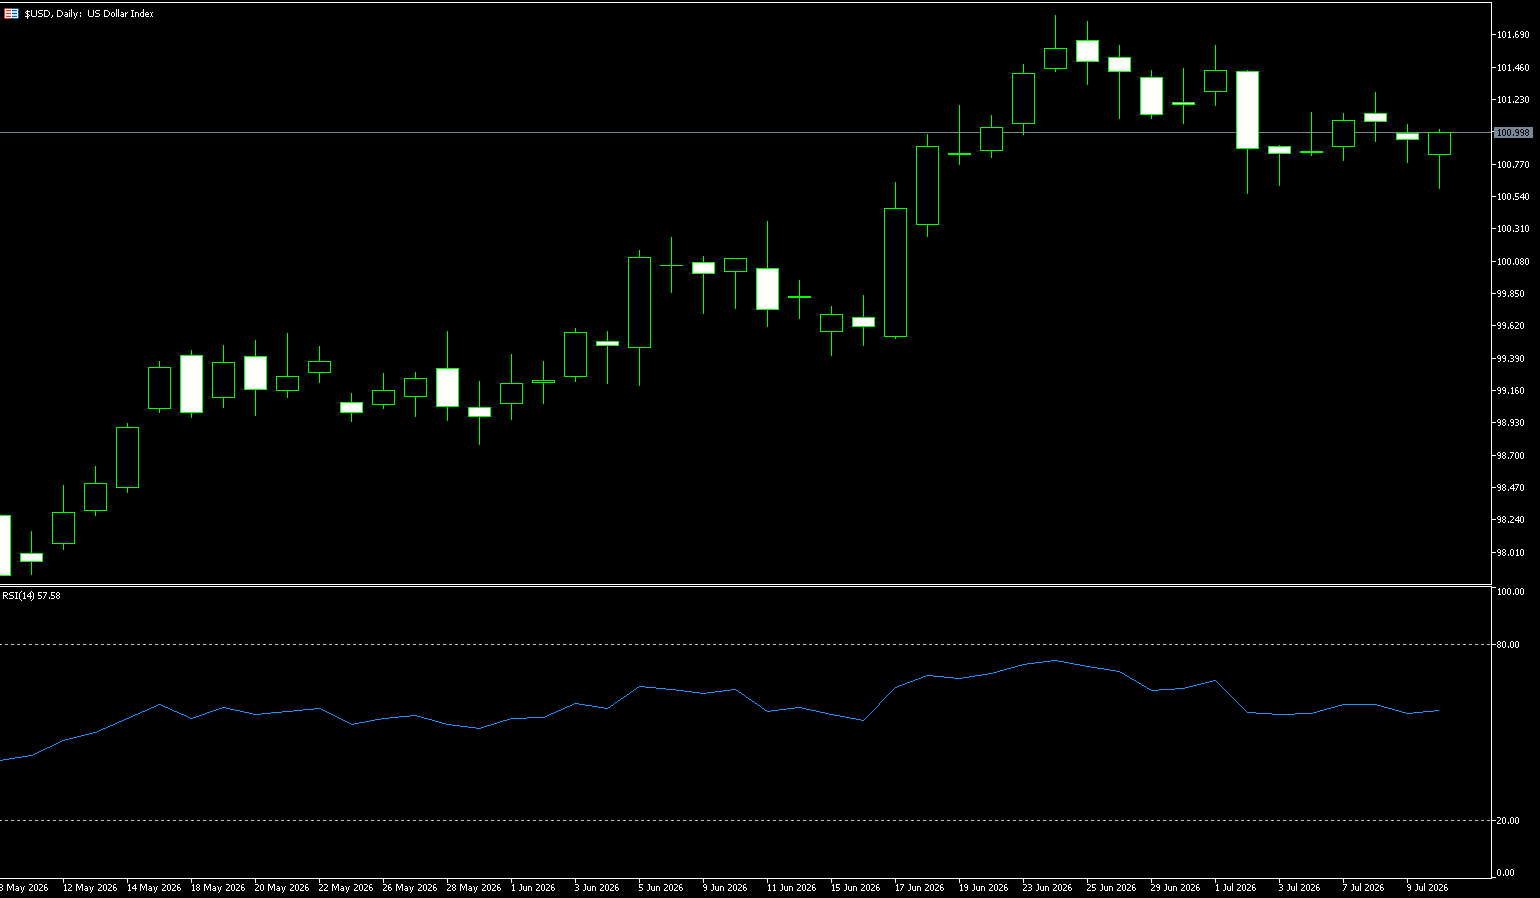
The US dollar index fell to a near three-week low of around 100.60 in late last week, marking its third consecutive day of decline, as news of continued peace talks between the US and Iran, despite recent escalation of hostilities reducing safe-haven demand for the currency, contributed to the decline. Falling oil prices also helped ease inflation concerns and reduce expectations of aggressive policy tightening, although the market still widely anticipates at least one Fed rate hike this year. Meanwhile, New York Fed President John Williams stated that among the factors driving US inflation, he is most concerned about demand driven by artificial intelligence. On the other hand, Fed Chairman Kevin Walsh announced the leadership of five working groups aimed at reviewing the US central bank's practices in key areas of policymaking, hinting at potential changes in Fed monetary policy. On Friday, the dollar weakened broadly, with the largest declines against the yen and New Zealand dollar.
The market is clearly optimistic about renewed US-Iran tensions. Multiple reports indicate that traffic in the Strait of Hormuz has nearly ceased in recent days, with almost no sign of de-escalation from either side. The US dollar has not benefited from this situation. The easing of geopolitical risks means the market remains focused on interest rate differentials, which in some cases (e.g., against the euro) can be detrimental to the dollar due to the reshaping of hawkish expectations overseas. Investors may be underestimating the possibility of a renewed closure of the Strait of Hormuz and a non-linear surge in oil prices. The balance of risks for the dollar remains skewed to the upside, although a slight increase in oil prices and a rapid shift in market fatigue towards headlines may keep the dollar index largely unchanged.
Last week, the dollar index generally exhibited a pattern of initial resistance followed by a gradual decline, resulting in short-term weakness and fluctuations. The high was 101.27 and the low was 100.60, with a narrowing range during the week and a significant weakening of bullish momentum. The daily chart shows that the rebound from the June low of 99.50 to 101.80 has entered the second wave of correction. Last week's attempt to break through to 101.27 failed, confirming the start of the correction. Meanwhile, Wednesday's closing price formed a "shooting star" pattern, followed by a low-volume bearish candlestick on Thursday and continued downward movement on Friday, a standard high-level pressure and pullback pattern. The MACD indicator maintains a golden cross above the zero line, but the red momentum bars are continuously shortening, indicating marginal exhaustion of bullish momentum and a risk of a death cross. As for the RSI (14), the current reading is around 57, entering a short-term consolidation pattern; there is still room for further decline in the short term, and a slight oversold rebound cannot be ruled out. At this week's high, the RSI touched 58, unable to break through the strong 60 range, indicating insufficient upward momentum.
Meanwhile, the short-term 5/10-day moving averages have turned downwards, and the index has fallen below these short-term moving averages, signaling a short-term bearish trend. The 50-day moving average at 99.81 continues to rise, indicating a still bullish medium-term trend; the short-term movement is merely a pullback after the initial rise and has not yet formed a trend reversal. The 9-day moving average at 101.03 continues to provide resistance, clearly indicating medium- to long-term pressure. The intraday high of 101.27 forms the first short-term resistance level. Last week, the index attempted to rise three times, but all attempts failed below 101.30. If the closing price holds above this level, it will open up upward potential, with the next target being the psychological level of 101.80 (the high of June 24th), while the psychological resistance level of 102 is considered a strong short-term resistance. Furthermore, the 101 level is the core of the intraday battle between bulls and bears, and also the closing price for the day. The key support level below is last Friday's low of 100.60. Once this support is broken, the index will begin a downward test of the 100.16 level (the 40-day moving average).
Today, consider shorting the US Dollar Index at 101.04, with a stop-loss at 101.14 and targets at 100.65 and 100.60.
WTI Crude Oil
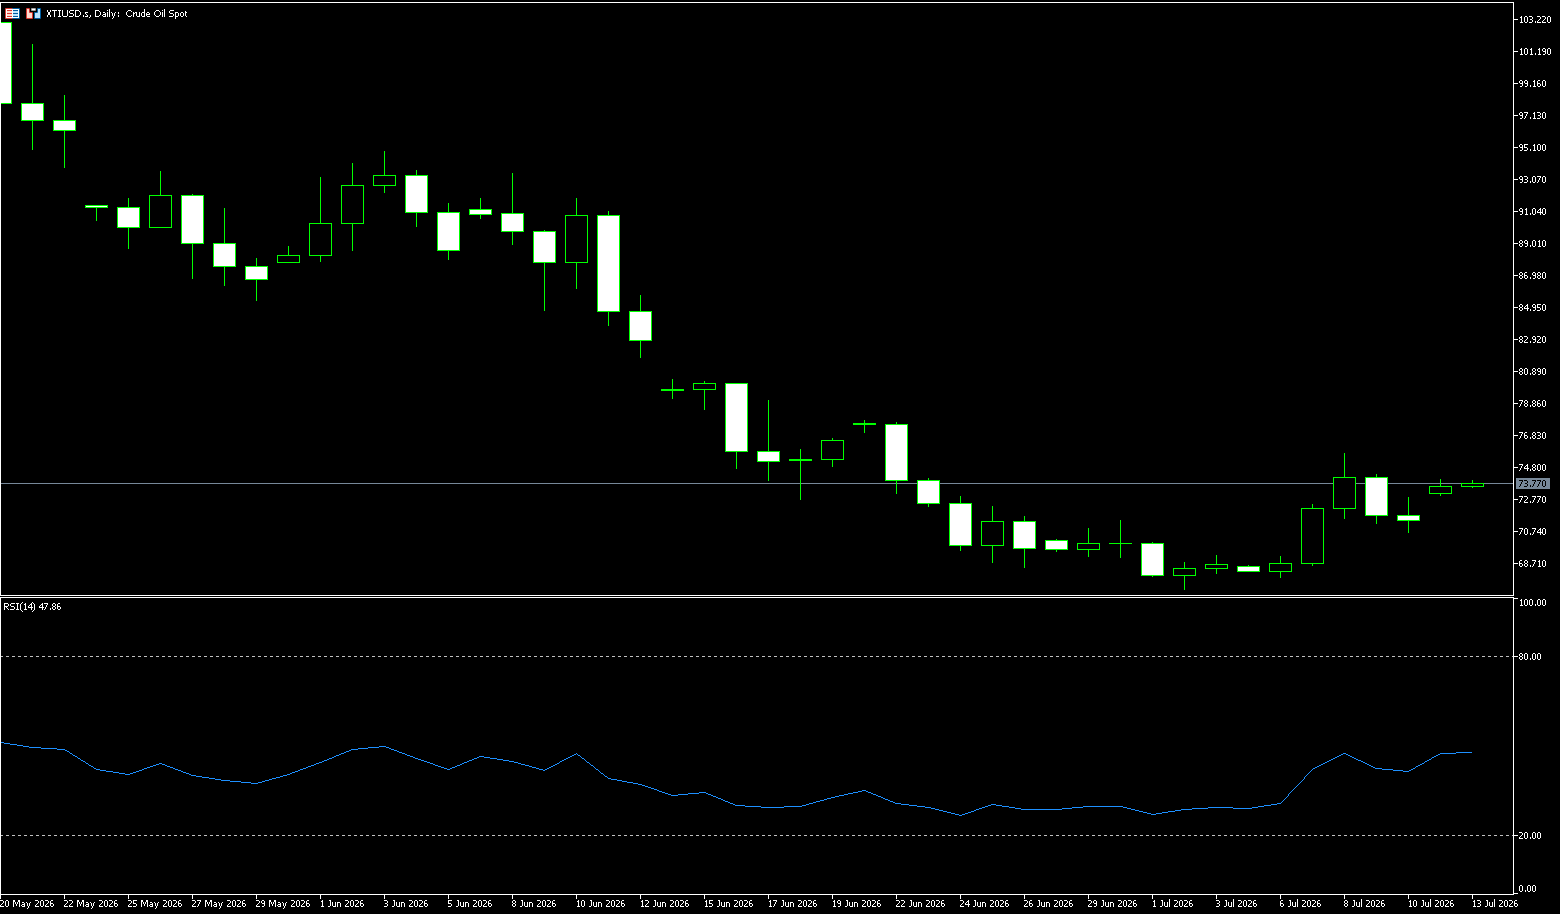
Before the end of last week, WTI crude oil prices fluctuated around $72 per barrel, having previously rebounded to a near three-week high of $75.73. Despite reports indicating that recent escalation of hostilities has disrupted energy transport through the Strait of Hormuz, the US and Iran will continue peace talks. Nevertheless, US benchmark WTI crude oil prices are still on track to rise more than 5% this week after US military strikes against Iranian targets for two consecutive days in response to recent attacks on ships in the Strait of Hormuz, prompting Tehran to retaliate against US bases in the region. President Donald Trump expressed skepticism about the interim peace agreement after renewed fighting, declaring it over. Shipping traffic in the Strait of Hormuz slowed sharply this week, with markets closely watching whether transit activity will return to normal. This strategic waterway remains a key obstacle in US-Iran negotiations.
In the short term, sporadic military skirmishes, targeted strikes, and countermeasures between the two sides will continue. Trump's aggressive governing style and low tolerance mean the US will not tolerate any provocative actions from Iran, and military deterrence will remain in place, keeping Middle East geopolitical risk premiums high. However, from a long-term perspective, neither the US nor Iran intends a full-scale war: the US aims for maximum pressure and using force to promote dialogue, while maintaining diplomatic channels and restraining escalation; Iran, with a strong counterattack, is holding its ground and seeking bargaining chips, unwilling to completely escalate the conflict. Coupled with external constraints from continued international mediation, the situation will likely shift between military friction and escalating diplomatic maneuvering. A ceasefire and stabilization are likely, with multiple rounds of technical negotiations restarting. However, due to core differences in interests, a substantial reconciliation is unlikely in the short term, and the underlying confrontation between the US and Iran will continue.
Last week, WTI crude oil prices rebounded after a sharp decline, closing positive on the weekly chart. However, the overall long-term downtrend has not reversed, and short-term price action is characterized by range-bound trading, with geopolitical risk aversion and negative inventory levels creating a two-way pull. The main trend remains bearish. After five consecutive weeks of declines, this week saw a corrective rebound, but oil prices remain under pressure below the 200-week moving average of $74.38 and the 23.6% Fibonacci retracement level of the May decline at $75.81. Technically, the weekly MACD histogram has contracted significantly, suggesting a potential golden cross that has not yet materialized; the weekly RSI has rebounded from oversold 32 to 43.89, but failed to break above the 50 neutral level, indicating a weak rebound rather than a reversal.
From a weekly perspective, despite the significant volatility this week, WTI is still expected to record a modest weekly gain. This provides some positive signals for the short-term technical outlook. However, the short-term direction remains unclear. On the upside, the previous sharp decline has led to deeply oversold conditions in the RSI and MACD indicators, creating a technical oversold rebound potential. If the US-Iran conflict escalates again, oil prices could quickly rebound above the 200-week moving average of $74.38 and reach $75.73 (last week's high). On the downside, if there is a substantial breakthrough in diplomatic channels, coupled with the impact of increased OPEC+ production and rising inventories, oil prices may retest the psychological support level of $70, or even lower, potentially falling to the level where a double bottom support formed at the previous low of $66.60. There is significant buying support in this area. The next directional breakout may be accompanied by new geopolitical or economic catalysts.
Today, consider going long on crude oil at 71.28, with a stop-loss at 71.10 and targets at 73.00 and 73.50.
Spot Gold
Gold held steady near $4,100 per ounce until the end of last week and is expected to remain largely unchanged by the end of this volatile week, as investors continue to assess developments in the Middle East and their potential impact on inflation and monetary policy. Reports indicate that the US and Iran will continue peace talks, despite recent escalations of hostilities disrupting energy flows in the Strait of Hormuz and reigniting inflation concerns. US military strikes against Iranian targets within two days in response to recent attacks on ships in the Strait of Hormuz prompted retaliatory strikes by Tehran against US bases in the region. Markets continue to expect at least one Fed rate hike this year, although the policy outlook remains highly uncertain. Meanwhile, New York Federal Reserve President John Williams stated that among the factors driving US inflation, he is most concerned about demand driven by artificial intelligence.
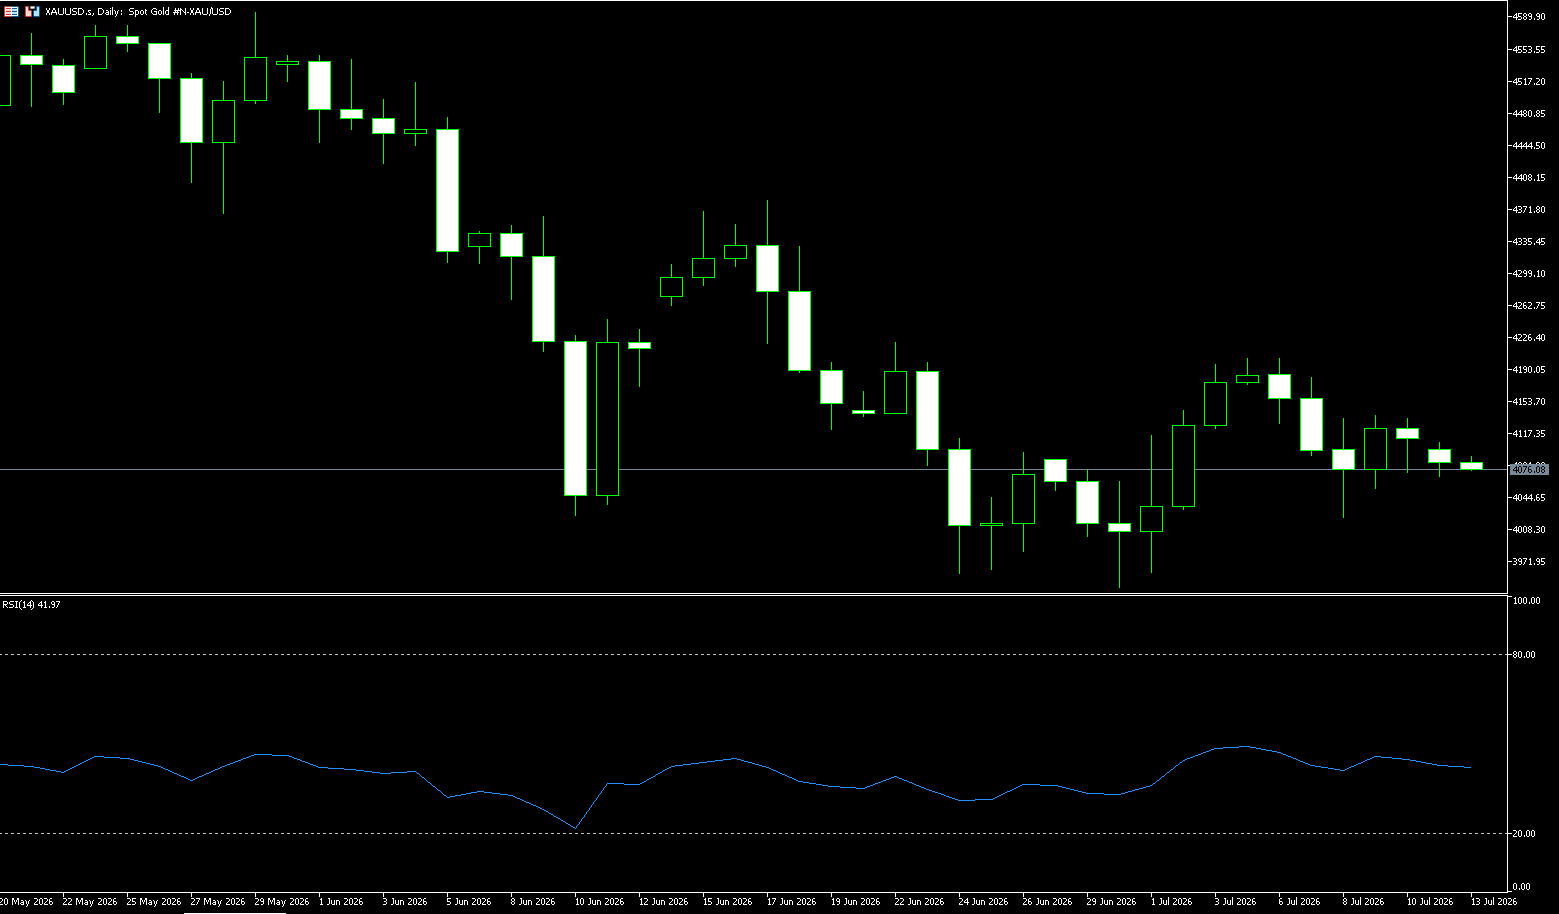
Gold retreated to slightly above $4,100, and is expected to decline by about 1.5% for the week. Precious metals weakened this week as renewed tensions in Iran pushed up oil prices, putting pressure on central banks to raise interest rates. The gold market is currently in a tense calm, seeking direction, with rumors suggesting mediators are working to bring Washington and Tehran back to the negotiating table. The US remains committed to finding a solution, and technical talks to reach a nuclear agreement are ongoing. The dollar index, which measures the dollar against six major currencies, has rebounded from near a three-week high amid cautious market sentiment and is gradually approaching the 101.00 level, limiting gold's upside potential.
Gold had previously closed lower for four consecutive weeks, forming a low of $3,941.50 (the low on June 30th). Last week saw a positive close, halting the decline, but this week saw a rise followed by a pullback. The weekly high of $4,202.60 met resistance and continued to decline. In the medium term, it remains in a weak corrective consolidation phase after a large-scale decline, and the bullish trend has not yet reversed. Gold prices are generally trading below the 50-week moving average (4306.90), indicating that the medium-term bearish pressure remains. This rebound is merely a downward correction; a bullish reversal requires a firm hold above $4,200-$4,202 and a break above the key 50-week moving average (4306.90) retracement level. The weekly RSI is in the neutral-to-weak range of 40, not yet oversold; the MACD histogram has narrowed significantly but has not formed a valid golden cross, indicating insufficient bullish momentum. This week is likely to close with a doji/small bearish weekly candlestick.
Regarding the moving average system, the short-term 5/10/21-day moving averages have all turned downwards, with the 21-day moving average at $4,135 turning from support into strong resistance. Prices continue to trade below these moving averages, indicating short-term bearish dominance. The medium-term 50-day moving average at $4,306.70 is far from the current price, creating significant selling pressure and severely limiting the potential for a medium-term rebound. Gold/USD is currently trading around $4,100, slightly below the trendline resistance from the early March lows, although higher lows earlier this week suggest a possible waning of bearish momentum. Indicators on the daily chart also show weakening bearish momentum, but there are currently no clear signs of a trend reversal. However, gold prices first need to break through the aforementioned structural trendline resistance, currently around $4,175, followed by the level slightly above $4,200 on July 6th and the 50-week moving average at $4,306.90. Support below is concentrated in the $4,021.80 area near last Wednesday's lows and near the late June lows at $3,941.70.
Consider going long on gold today at $4,115, with a stop-loss at $4,110 and targets at $4,160 and $4,170.
AUD/USD
Last week, the Australian dollar rose to around US$0.6950, but is expected to remain largely flat this week as investors focus on developments in the Strait of Hormuz following escalating tensions in the Middle East. The safe-haven US dollar strengthened, while oil prices rose following the US-Iran military strikes in the Gulf earlier this week. However, despite the recent escalation, both countries are now prepared to resume peace talks. Meanwhile, the International Monetary Fund lowered its 2026 growth forecast for Australia from 2.0% to 1.9%, warning that inflation will remain high at around 4% this year. The Reserve Bank of Australia will meet in August and is expected to keep the cash rate unchanged at 4.35%, although the market still anticipates a roughly 60% chance of a final rate hike later this year, depending on oil price movements. Traders are also awaiting key employment and inflation data later this month, which could provide new clues about the policy outlook.
According to Reuters, RBA Assistant Governor Sarah Hunt said on Wednesday that the board will act as needed to bring inflation back to target levels, warning that further policy tightening may be necessary if oil price shocks push up inflation expectations. The RBA has implemented three 25-basis-point rate hikes so far this year, raising the official cash rate (OCR) to 4.35%. The current 30-day interbank cash rate futures on the Australian Securities Exchange show that the market's expectation for an interest rate hike to 4.60% at the August meeting is only 19%.
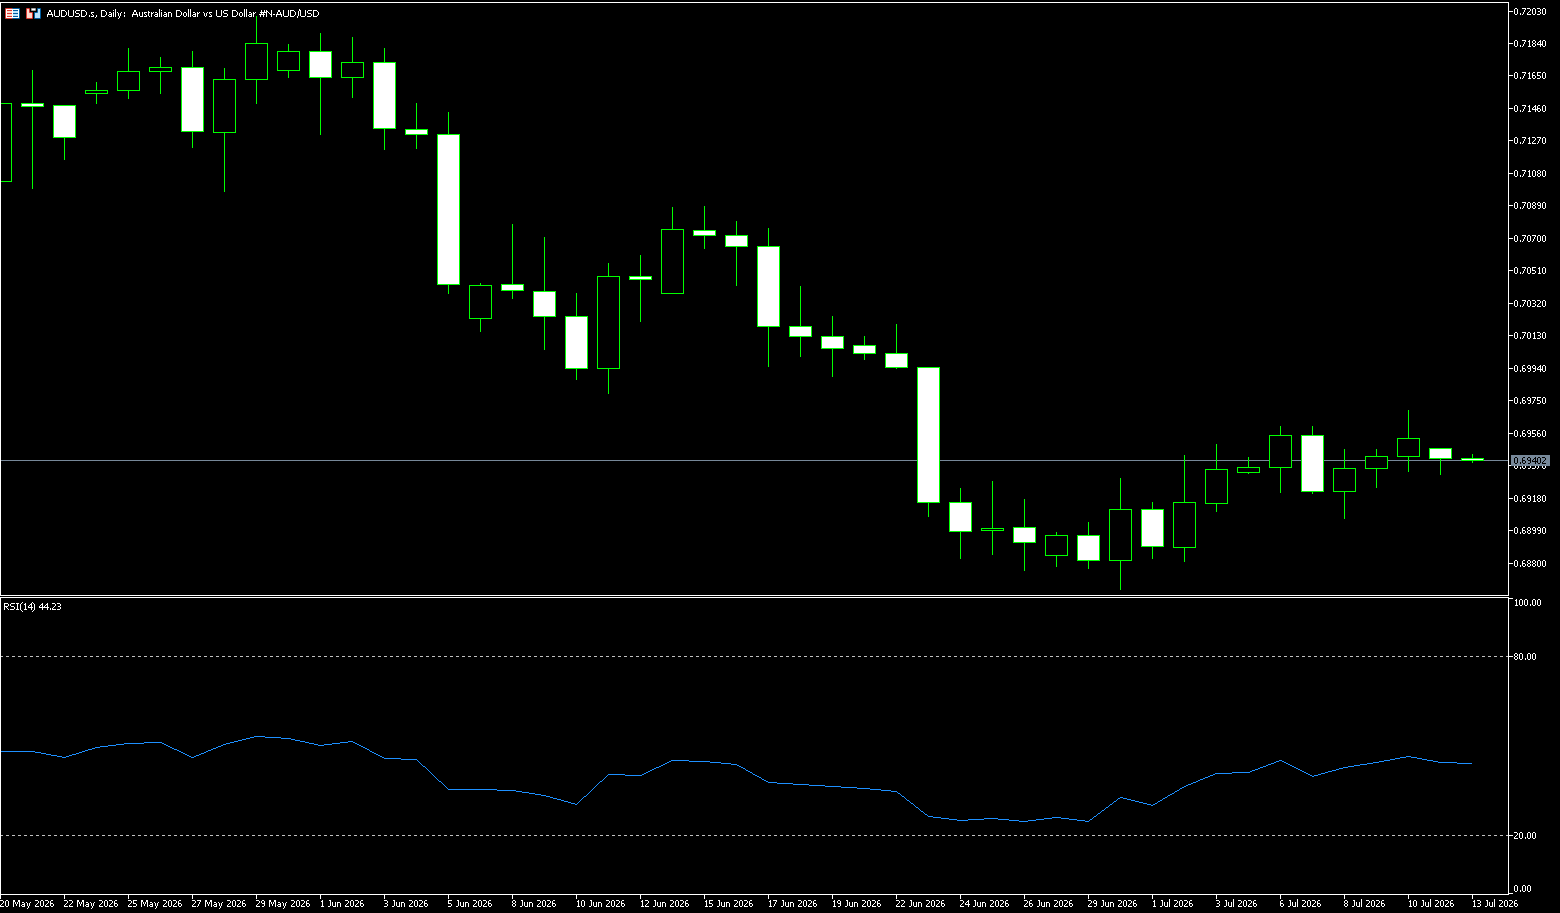
Last week, the overall trend was a low-level rebound followed by high-level fluctuations, with the bullish and bearish momentum converging. The daily chart shows a medium-term bullish bias, while the short-term trend is consolidating within a range, lacking the momentum for a unilateral breakout. Last week, the currency pair continued its rebound from the previous week's low of 0.6865, reaching a high of 0.6969 and a low of 0.6931, with a narrowing range. The weekly chart stabilized above the key medium-term support of the 200-day moving average at 0.6876, repairing the downward structure and shifting the medium-term trend from bearish to neutral-bullish. Technical indicators: MACD: DIFF and DEA remain above the zero axis, but the red bars continue to narrow, indicating a continued decline in upward momentum and an accumulation of short-term pullback risk. RSI(14): Stable in the 52-55 range, neutral-bullish, with no overbought/oversold signals and no extreme unilateral signals. Currently, the price is holding above the 5/20-day moving average, with the 5-day moving average at 0.6940 acting as short-term dynamic support. A break below this level would trigger a short-term pullback.
From a technical perspective, an unexpected easing of tensions in the Middle East could lead to a decline in energy prices, reducing the urgency for the Reserve Bank of Australia (RBA) to raise interest rates. Furthermore, stronger-than-expected US CPI data next week could reignite expectations of a Fed rate hike, reversing the weakening trend of the US dollar. The Australian dollar has found buying support near the 0.6906 (last week's low) and 0.6900 (psychological level) areas, maintaining its recent upward trend. If the RBA's hawkish stance is validated by subsequent data (such as stronger-than-expected Australian inflation or employment data next week), the exchange rate could further test the psychological level of 0.7000. A break above this level would target the 0.7071 (50-day moving average) level. On the downside, the 0.6900 level has become a recent support level. A break below this level could lead to a retest of the 200-day moving average at 0.6876, followed by the 0.6800 psychological level.
Today, consider going long on the Australian dollar at 0.6940, with a stop-loss at 0.6930 and targets at 0.6980 and 0.6990.
GBP/USD
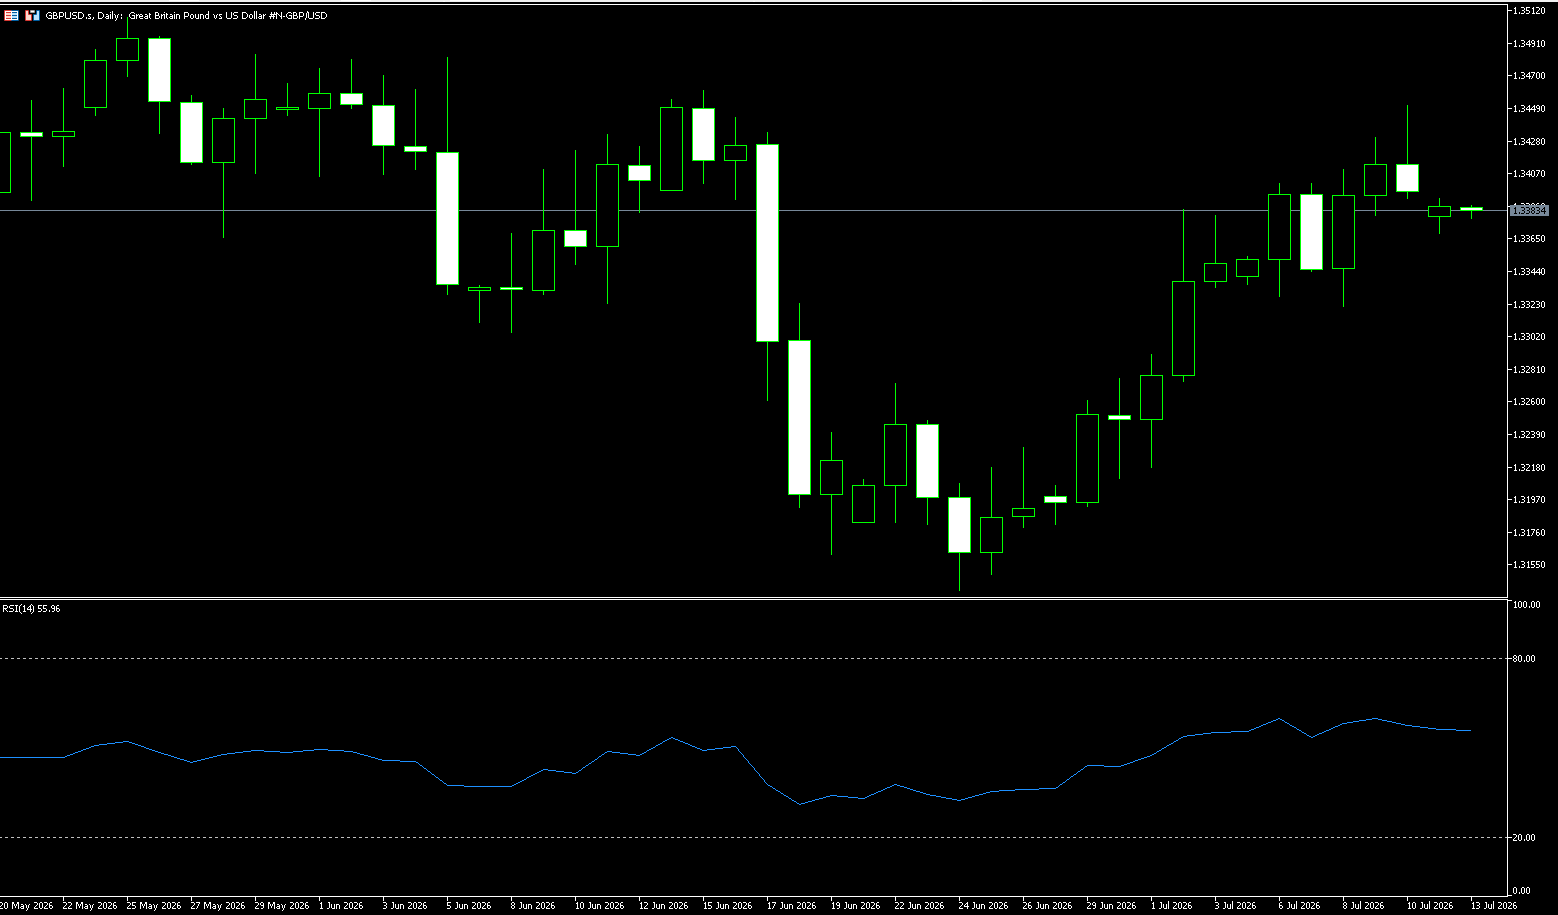
Last week, the pound rebounded to around $1.3450, its highest level since mid-June, as investors increased their bets on a Bank of England rate hike amid escalating tensions between the US and Iran. Investors also considered recent comments from US President Donald Trump, who stated that Iran remains “very eager” to reach a deal. Oil prices reached a two-week high on Wednesday due to a new round of US strikes against Iran, and Trump's announcement of the end of the ceasefire raised doubts about the stability of the peace agreement and exacerbated inflationary pressures. Investors now fully expect the Bank of England to raise interest rates by 25 basis points before the end of the year, most likely in December. Politically, Andy Burnham is the top choice to succeed Keir Starmer, but a Chancellor of the Exchequer has not yet been appointed, with former Energy Secretary Ed Miliband emerging as a possible candidate. The pound's resilience amid recent political turmoil suggests that most of the negative news has already been priced in by the market.
The transition of leadership in the UK government and increased market expectations for further interest rate hikes by the Bank of England have supported the pound's strength against the dollar. Andy Burnham's path to becoming the next British Prime Minister appears clear, as a vast majority of Labour MPs have formally nominated him as their next leader. At the end of the first day of the Labour leadership contest, 322 out of 403 Labour MPs voted for Burnham, replacing Keir Starmer. Burnham is expected to officially become Prime Minister on July 20th. The sharp rebound in GBP/USD has left room to test the key resistance level of 1.3445, although a significant breakout in the near term is unlikely. While the risks are skewed to the upside, whether the pound can reach 1.3445 remains to be seen, as upward momentum has not yet strengthened further.
Last week, the British pound against the US dollar exhibited a slightly bullish trend, rebounding from a low of 1.3346 and currently fluctuating around 1.3420. The pound initially declined before rising, falling slightly on Monday due to a dollar rebound, but gradually stabilizing and recovering from Tuesday to Friday, with the price center shifting upwards, showing an overall upward trend. The RSI (14) momentum indicator is at 57.00, in the neutral-to-bullish zone, not yet overbought, suggesting further upside potential; the MACD lines are intertwined near the zero axis, with a moderate amount of red bars and converging momentum, indicating a weakening rebound; while the CCI has moved out of the oversold zone, forming two bullish divergences, suggesting the downtrend may be ending.
On the daily chart, the pound maintains a slightly bullish short-term bias against the US dollar, as the exchange rate is above the 34-day simple moving average of 1.3347. The pair is approaching the recent high of 1.3460 (June 15th). Last week, the currency pair formed a double bottom pattern, with the neckline located in the 1.3400-1.3410 area. A break above this neckline would theoretically target the 1.3500-1.3520 range, coinciding with the key resistance level of 1.3510 (the high of May 26th). On the upside, initial resistance lies at the June 15th high of 1.3460. A break above this level would see bulls challenge the 1.3500 (psychological level), then 1.3510 (the high of May 26th), followed by the 1.3550 level. Immediate support is provided near the 34-day simple moving average at 1.3342, while a deeper pullback could be capped by the 1.3300 (psychological support level).
Today, consider going long on GBP at 1.3390, with a stop-loss at 1.3380 and targets at 1.3450 and 1.3440.
USD/JPY
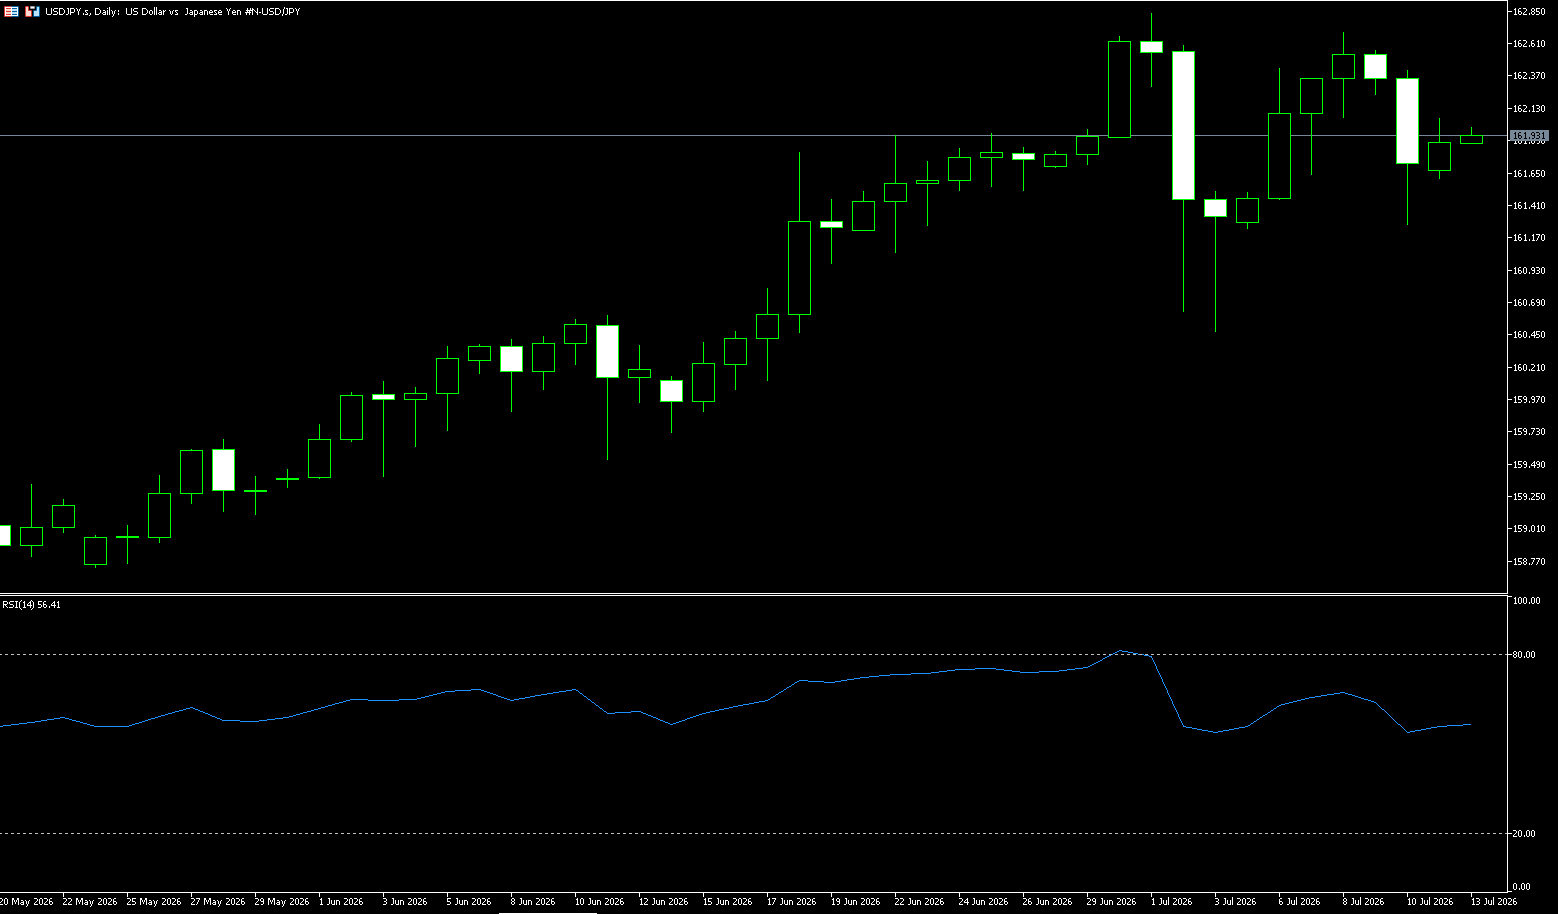
The USD/JPY pair saw a significant pullback before the end of last week, breaking below the 162.00 level. The market is reassessing the risks of Japanese government intervention in the exchange rate, the dollar's performance, and the impact of global risk aversion on the yen. The recent continued weakness of the yen has attracted attention from Japanese policymakers, and the market has begun to increase expectations that the government may take measures to stabilize the yen. With USD/JPY approaching multi-year highs, traders remain highly vigilant about potential intervention risks, which has become a significant factor driving the short-term yen rebound.
Furthermore, the interest rate differential between Japan and the United States remains an important factor influencing the exchange rate. Despite the Bank of Japan's gradual adjustments to monetary policy, Japan's financing costs remain significantly lower than those of major economies like the US, and carry trade demand persists. This makes investors hesitant to confirm that the USD/JPY pair has formed a long-term top. From a market sentiment perspective, USD/JPY is currently in a tug-of-war between policy risk and interest rate differential logic. On one hand, expectations of Japanese intervention and a weakening dollar are driving the exchange rate adjustment; on the other hand, the USD/JPY interest rate differential, safe-haven demand, and energy risks may still provide support for the dollar.
The USD/JPY pullback before the end of last week was mainly influenced by rising expectations of Japanese intervention and a weakening dollar, but the USD/JPY interest rate differential remains a crucial factor supporting the exchange rate. The pair may further test the 160 level. Current price: 161.55 (Friday Asian session close). This week's overall trend has been one of rising and falling, followed by high-level consolidation and correction. The long-term bullish structure remains intact, but short-term bullish momentum is weakening. The battle between bulls and bears is concentrated in the 160.80–162.85 range, with the core conflict being the USD/JPY interest rate differential bulls versus expectations of Japanese intervention and the downward pressure on the dollar from weak US economic data. Technical indicators: MACD: Both lines remain in the bullish zone above the zero axis, but the fast and slow lines have formed a short-term death cross, indicating weakening short-term bullish momentum and a need for correction. There are currently no signs of a trend reversal. RSI (14): After rising to 68, it fell back to around 54, returning from a strong zone to neutral. Overbought pressure has been released, and the balance between bulls and bears is temporarily balanced.
From the daily chart structure, USD/JPY has recently experienced a pullback from its highs. After the price broke below 162.00, short-term pressure increased. The daily moving average structure shows that the exchange rate is still in a long-term upward trend, but short-term momentum has weakened. Resistance is seen in the 162.16 (5-day moving average) to 162.84 (July 1 high) area. A break above this area could lead to a retest of the 164.00 level. Support is seen at 160.63 (40-day moving average) and the psychological level of 160.49 (July 3 low). A break below the psychological support of 160.00 could lead to a further decline towards the 159.30 (100-day moving average) area.
Consider shorting the US dollar at 161.85 today, with a stop loss at 162.00 and targets at 161.10 and 161.00.
EUR/USD
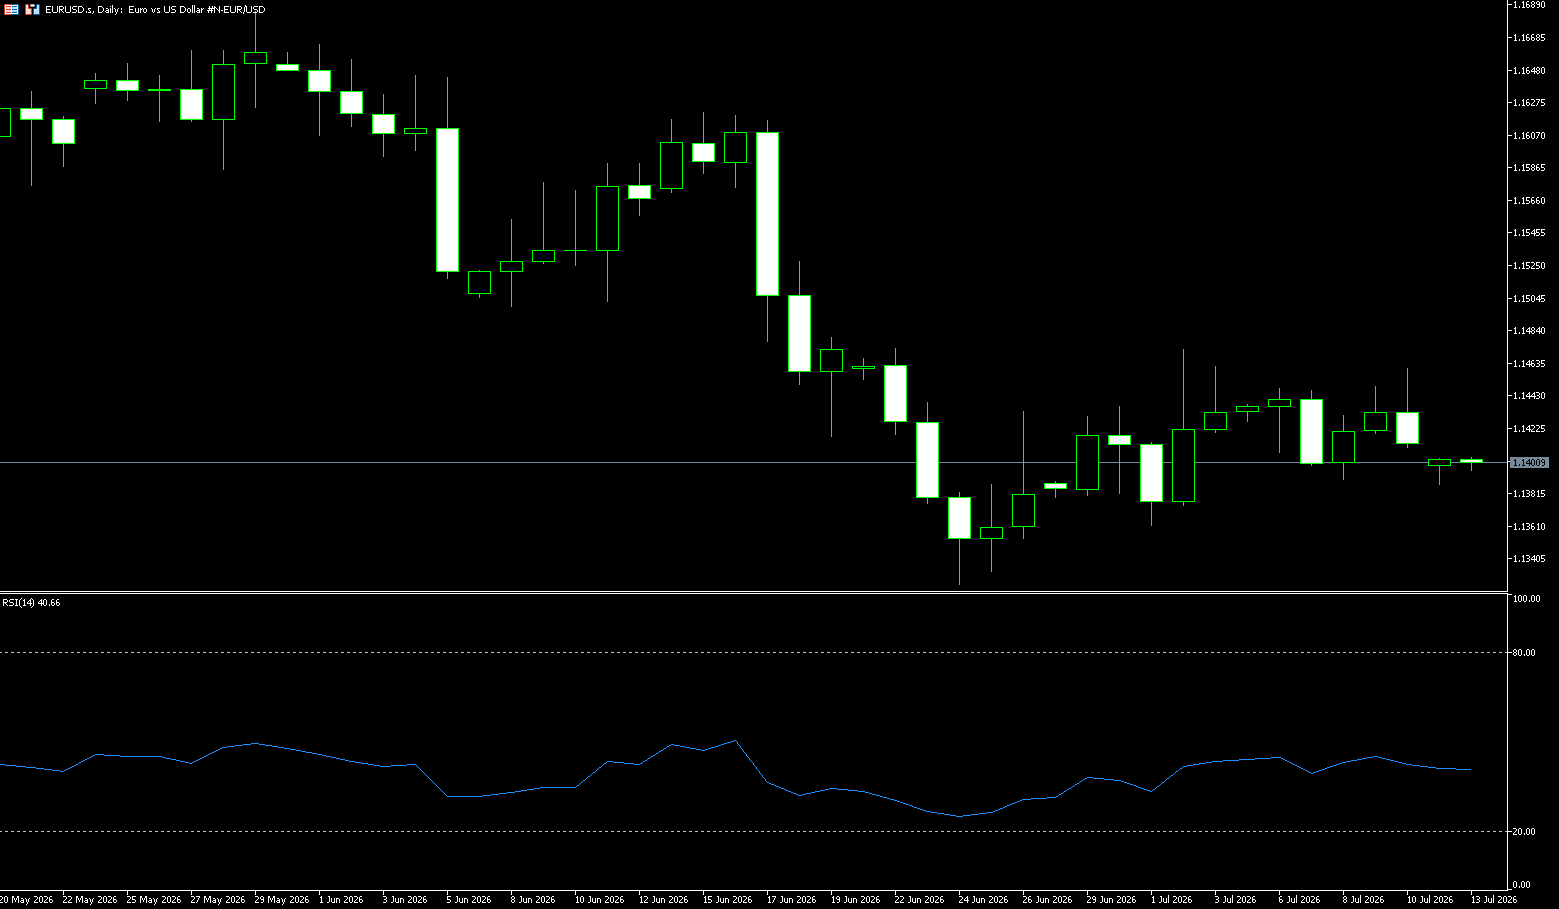
The euro rose above $1.1400 last week, attempting to rebound from a one-year low hit in June, as market expectations increased for another ECB rate hike in September. Brent crude reached a two-week high on Wednesday after renewed fighting between the US and Iran, with US President Trump announcing the end of the ceasefire. However, he also noted that Iran remains “very eager” to reach an agreement, offering some hope for resuming negotiations. Traders now expect the European Central Bank to raise interest rates by more than 30 basis points this year, suggesting at least one potential rate hike. Politically, the German cabinet approved the draft 2027 budget, outlining €555.4 billion in spending and increasing borrowing to €203.6 billion, higher than previous estimates. In France, far-right leader Marine Le Pen confirmed her candidacy for president in 2027, with polls showing her National Rally favored, while uncertainty remains regarding Macron's successor.
Middle East tensions have moderately tightened the euro/dollar short-term swap spread by about 10 basis points, although the spread remains wider than pre-war levels. While this supports expectations of a possible ECB rate hike in September, Pessole believes the euro/dollar's upward path is limited and warns of downside risks, including a potential retest of 1.140. While all of this has injected renewed confidence into previously waning expectations of a September ECB rate hike, the path for the euro/dollar to strengthen from this renewed escalation of tensions is rather narrow.
The EUR/USD pair traded in a narrow range last week, a continuation of the rebound after the June lows. The larger timeframe remains bearish, with the short-term support/resistance level at 1.1450 (July 9 high) – 1.1460 (25-day moving average). There were no clear one-sided moves; pullbacks and rallies were the main theme this week. Currently, the EUR/USD is trading within a low-level upward channel, with support at 1.1400 and resistance at 1.1490 – 1.1500. The pair has been confined to this channel throughout the week. Regarding moving averages, the 5-day moving average is flat, with prices repeatedly crossing it; the 50-day moving average at 1.1560 provides strong resistance; and 1.1324 (June 24 low) acts as a dynamic support level. Meanwhile, momentum indicators show a slightly constructive outlook. In fact, the Relative Strength Index (RSI)... The EUR/USD pair is hovering below 60, while the MACD histogram is slightly positive.
From a technical perspective, the pair struggled to find support above the 23.6% Fibonacci retracement level of the April-June decline and was rejected near the resistance of the ascending channel last Thursday. Against the backdrop of the recent decline, this upward-sloping channel forms a bearish flag pattern. This keeps the 200-period exponential moving average at 1.1508 on the 4-hour chart acting as resistance, further reinforcing the supply zone above. The next relevant resistance level is locked at the 50-day exponential moving average at 1.1560. Above that, the psychological level of 1.1600 forms a broader resistance barrier. On the downside, the first significant support appears at the 1.1400 level. Secondly, the support level is around 1.1371, near the lower boundary of the ascending channel. If the bearish pressure continues, the previous channel starting area around 1.1324 (the low of June 24th) will become a secondary support level.
Today, consider going long on the Euro at 1.1405, with a stop loss at 1.1395 and targets at 1.1450 and 1.1440.
Stock Analysis:
Australian ASX 200 Stock Index
Basic Market Overview:
The Australian Securities Exchange (ASX) 200 index rose 44 points, or 0.5%, to close at 8,806 on Friday, ending a four-day losing streak, driven by gains in mining, financial, and industrial stocks. Mining stocks rebounded on rising iron ore and copper prices, with heavyweights BHP Group, Rio Tinto, and Fortescue rising between 2.0% and 3.8%. Shares of the four major banks rose between 0.3% and 0.7%. However, the benchmark index fell 0.4% for the week, reversing gains from the previous week, after the International Monetary Fund lowered its 2026 growth forecast for Australia from 2.0% to 1.9% and warned that inflation could remain high at around 4% this year.
Looking ahead, investors will be focused on key Chinese economic data releases next week, including June trade data, activity figures, and second-quarter GDP, for clues about demand in Australia's largest export market. Locally, focus will shift to the July business and consumer confidence surveys, as well as consumer inflation expectations.
Sector Performance:
Top Performing Sectors This Week (Sorted by Weekly Gain):
1. Information Technology (IT) (XIJ): Weekly gain +1.01% (strongest in the market)
• Core Drivers: Continued strength in WiseTech Global and NextDC; defensive growth funds flocking to software and data centers; management reshuffle eliminates uncertainty, funds continue to flow into growth technology stocks.
• Representative Stocks: WiseTech Global, NextDC, Computershare.
2. Telecommunications Services (XTJ): Slight weekly gain
• Logic: High dividend yield and defensive attributes; global geopolitical risk aversion; volatility far less than cyclical resource stocks.
3. Financials (XFJ): Slight gain
• The four major banks steadily rose; Australian wage data showed a moderate cooling; market expectations for interest rate cuts slightly increased; investment banks such as Macquarie also strengthened, with heavyweights offsetting downward pressure on the overall market.
This Week's Leading Declining Sectors (Top Losers)
1. Materials & Mining (Weekly -4.41%, Weakest Sector This Week)
A stark contrast: A 2.32% surge on Friday, but followed by four days of continuous selling due to Middle East shipping conflicts, concerns about Chinese demand, and a correction in commodity prices, resulting in the largest weekly decline.
• Dragging down individual stocks: BHP, Rio Tinto, and FMG continued to decline throughout the week; only rebounding on Friday with the recovery in iron ore and gold prices.
2. Healthcare (XHJ) Significantly Weakened This Week
After a cumulative 13.7% gain in the previous month, large-scale profit-taking occurred this week; Pro Medicus, CSL, and Ramsay Health all saw corrections, indicating a shift of funds out of defensive sectors.
• Daily Performance: A sharp 1.96% drop on Friday, the biggest drag on the market throughout the day.
3. Consumer Discretionary Goods
Retail and leisure consumption weakened, domestic consumer confidence cooled, and household spending expectations weakened, putting continued pressure on the sector throughout the week.
4. Energy and REITs Weakened Simultaneously
Oil price volatility weighed on oil and gas stocks; interest rate concerns suppressed commercial real estate trust valuations, resulting in a volatile downward trend throughout the week.
Technical Analysis:
The ASX200 index closed at 8806 points on Friday, down 0.43% for the week, ending a four-day losing streak. Resources and banks led a technical recovery on Friday, but the weekly chart closed negative, indicating an overall consolidation phase with a slightly bearish bias at high levels. Currently, the ASX200 index's trading range continues to narrow, and it is likely to choose a direction in the next 1-2 weeks. A breakout would amplify volatility, making stop-loss orders more likely to be triggered. The 50-day and 200-day moving averages are converging; if both lines are broken simultaneously, the medium-term consolidation pattern will weaken, and the downside potential could extend to 8600. The daily chart shows a bottoming-out and rebounding weekly doji, indicating increased divergence between bulls and bears. The RSI (14-period): fell from 53 to 42 this week, not entering oversold territory (30), indicating insufficient rebound momentum and no clear reversal signal. ADX trend strength: ADX < 25, indicating no unidirectional trend and a volatile market with extremely poor profit/loss ratio for chasing trades. Market breadth: the ratio of rising to falling stocks remained below 1 this week, with only resources and banks providing support, while healthcare, consumer goods, and technology all weakened, showing severe divergence among heavyweight stocks.
Trading Strategy:
The following are only technical trading ideas and do not constitute investment advice. Leveraged trading may result in losses exceeding the principal.
Short-term Long Strategy (Buy on Dips)
Entry Conditions (Meet at least 2 conditions):
1. Price retraces to the 8770–8730 support range;
2. Bullish candlestick patterns appear on the hourly chart (morning star, bullish engulfing pattern);
3. Iron ore/copper strengthen simultaneously, and US stock futures do not decline significantly. Entry Range: 8730–8770
• Stop Loss: A confirmed break below 8700 (30 points below the 50-day moving average, exit if the breakout is confirmed)
• First Take Profit: 8840 (20-day moving average, reduce position by half upon encountering resistance)
• Second Take Profit: 8890–8915 (weekly high, exit all positions)
Short-Term Short-Selling Strategy (Rally with Resistance)
Entry Conditions (Meet at least 2 conditions)
1. Rebound to 8830–8840 but fails to hold above the 20-day moving average;
2. Bearish candlestick pattern appears on the hourly chart (evening star, shooting star);
3. Weakening expectations for Chinese commodity prices and a strengthening Australian dollar suppress export resource stocks.
Entry Range: 8830–8840
• Stop Loss: Exit at 8920 (30 points above last week's high)
• First Take Profit: 8776 (200-day moving average support, reduce position)
• Second Take Profit: 8728 (50-day moving average, exit all positions)
Key Risk Warnings:
News-driven Gap Risk: Chinese data, RBA official speeches, and Middle East geopolitical conflicts can easily cause opening gaps, making it difficult to accurately execute stop losses;
Frequent Trading Trap in a Volatile Market: Repeatedly opening positions in the absence of a clear trend can easily lead to consecutive small losses, resulting in a larger cumulative drawdown;
Single-weighted Risk: The ASX200 Financials + Resources sector accounts for over 60% of the index; a sharp drop in a single sector can cause the index to decline rapidly, resulting in weak diversification.
Dow Jones Industrial Average
Basic Market Overview:
US stock indices closed higher on Friday, heading into earnings season, with SK Hynix surging in its market debut. The S&P 500 rose 0.4%, the Nasdaq 100 rose 0.3%, and the Dow Jones Industrial Average gained 150 points. SK Hynix's American Depositary Receipts (ADRs) rose 12.8% from their offering price, raising $26.5 billion in the largest U.S. listing by a foreign company. Among chipmakers, performance was mixed, with Nvidia rising 4% and AMD rising 2%, while Broadcom fell 0.3% and Intel fell 2.4%.
In the technology services sector, Meta rose 6% after research firm SemiAnalysis released a positive report on its AI computing business. Meanwhile, financial stocks and other traditional sectors received support as oil prices halted their rebound, easing concerns about another Federal Reserve rate hike. JPMorgan Chase rose 0.3%, while Mastercard and Bank of America both rose 0.7%. In manufacturing, Applied Materials rose 2.4%, while Caterpillar rose 1.6%.
Sector Performance:
Leading Sectors:
Leading Sectors (Positive Contribution to Dow Jones)
1. Technology Sector (Dow Jones IT Sector, 18.38% Weighting): Nvidia, IBM, and Microsoft benefited from AI computing power and semiconductor market rallies. SK Hynix's IPO boosted sentiment in the chip sector, and Micron's surge led to a rebound in technology stocks. The technology sector was among the top gainers on Thursday.
2. Financial Sector (Dow Jones' Largest Weighting, 27.2%): Bank net interest margin pressure eased somewhat amid expectations of interest rate cuts. JPMorgan Chase and Goldman Sachs showed strength amid volatility, with defensive funds slightly positioning themselves in financial blue chips to hedge against fluctuations.
3. Healthcare: Safe-haven funds allocated to defensive healthcare. Johnson & Johnson and UnitedHealth Group showed stable performance and were the most resilient throughout the week.
Leading Declining Sectors (Draging Down the Dow Jones Core)
1. Industrials (18.25% weighting): Aviation, transportation, and heavy industry were pressured by falling oil prices and weak global manufacturing sentiment. Caterpillar, 3M, and UPS continued to weaken throughout the week, making them the biggest drag on the economy.
2. Energy and Consumer Staples: Crude oil prices fell, leading to declines in Chevron and ExxonMobil. The defensive premium in consumer staples faded, and weakness offset the recovery in market risk appetite. Dow Jones Industrial Average (DJIA) Component Stock Performance Analysis:
Strong Performers This Week: Microsoft, JPMorgan Chase, Johnson & Johnson, IBM
Weak Performers This Week: Caterpillar, 3M, Boeing, Chevron, Coca-Cola
Technical Analysis:
Last week, the DJIA surged and then retreated. It broke through 53,000 points intraday on Monday, reaching a new all-time high, before weakening and closing down slightly for the week, approximately 0.8%. It closed at 52,478.41 points on Thursday, a daily gain of 0.27% (+139.02 points). The DJIA significantly underperformed the Nasdaq (up 1.5% for the week). The core reasons were: funds rotating from high-dividend value blue-chip stocks to AI technology growth stocks; and the decline in oil prices dragging down industrial and energy stocks, thus suppressing the DJIA's performance. Macroeconomic drivers included: easing geopolitical tensions in the Middle East and declining oil prices; market pricing in rising expectations of a Fed rate cut this year, leading to a decline in the 10-year US Treasury yield during the week; and capital inflows into the semiconductor and AI sectors diverting funds from the DJIA. The Dow Jones Industrial Average (DJIA) is steadily trading above its 50, 144, and 200 EMAs, with the moving averages in a bullish alignment, indicating a complete medium- to long-term uptrend. The 53,000 level presents strong psychological and technical resistance, and profit-taking occurred after the initial surge. The weekly chart shows a doji candlestick pattern, indicating a short-term consolidation phase at higher levels. The RSI has retreated after reaching overbought territory, and the MACD histogram is shortening, suggesting a potential for short-term correction. The VIX volatility has risen slightly above 18, indicating a slight increase in market risk aversion, making a rapid breakthrough of previous highs unlikely in the short term.
Trading Strategies:
Bull Strategy
• Entry Conditions: A small long position can be initiated if the price retraces to the 52200 support level and stabilizes, followed by a positive intraday close.
• Target: Take profit in batches at the 52800 → 53000 resistance levels.
• Stop Loss: Exit if the price breaks below 51900, confirming the start of a correction.
Bear Strategy (Swing Correction)
• Entry Conditions: Multiple tests of the 53000 resistance level followed by a negative daily close.
• Target: 52200 support level; a break below this level targets 51600.
• Stop Loss: Stop loss at 53100; the bearish logic becomes invalid after a new high.
Risk Warnings:
Macroeconomic Interest Rate Risk: If US inflation data rebounds, expectations of interest rate cuts cool, and US Treasury yields surge, directly pressuring high-valuation blue-chip stocks in the Dow Jones Industrial Average, triggering a deep correction.
Geopolitical and Oil Price Risk: Escalating conflicts in the Middle East could push up oil prices, suppressing the weighting of industrial and consumer sectors and dragging down the index.
Risk of fund rotation: Funds continue to migrate to Nasdaq AI growth stocks, while Dow Jones value blue chips may continue to underperform the broader market.
Technical risk: If the 51600 mid-term support level is effectively broken, the current upward trend will have ended for a period, and the potential for a correction will increase.
Disclaimer: The information contained herein (1) is proprietary to BCR and/or its content providers; (2) may not be copied or distributed; (3) is not warranted to be accurate, complete or timely; and, (4) does not constitute advice or a recommendation by BCR or its content providers in respect of the investment in financial instruments. Neither BCR or its content providers are responsible for any damages or losses arising from any use of this information. Past performance is no guarantee of future results.
更多報導








風險披露:衍生品在場外交易,採用保證金交易,意味著具有高風險水平,有可能會損失所有投資。這些產品並不適合所有投資者。在進行交易之前,請確保您充分了解風險,並仔細考慮您的財務狀況和交易經驗。如有必要,請在與BCR開設帳戶之前諮詢獨立的財務顧問。
BCR Co Pty Ltd(公司編號1975046)是一家依據英屬維京群島法律註冊成立的公司,註冊地址為英屬維京群島托爾托拉島羅德鎮Wickham’s Cay 1的Trident Chambers,並受英屬維京群島金融服務委員會監管,牌照號碼為SIBA/L/19/1122。
Open Bridge Limited(公司編號16701394)是一家依據2006年《公司法》註冊成立並在英格蘭及威爾斯註冊的公司,註冊地址為 Kemp House, 160 City Road, London, England, EC1V 2NX. Open Bridge Limited僅作為BCR Co Pty Ltd的付款處理方運作,並不代表其提供任何金融、交易或投資服務。Open Bridge Limited的角色僅限於付款處理。


 English
 简体中文
简体中文
 繁體中文
繁體中文
 Bahasa
Melayu
Bahasa
Melayu
 Tiếng
Việt
Tiếng
Việt
 ไทย
ไทย
 日本語
日本語
 한국어
한국어
 ភាសាខ្មែរ
 español